The Effect of Air Pollution
In order to guide us in understanding the significance (or otherwise) of the readings from the St. Marys Lane sensor we looked for the single figure that best represented the average, overall effect of the sort of pm2.5 and pm10 concentrations we saw (i.e. pm2.5 values around 5 - 15 μg/m3).
-
We found estimates of the effects of air pollution on several individual medical conditions,
but fastened on long-term, all-age, all-cause, death rate, as being more generally applicable.
We hoped this could be used to understand and check...
- community action or policy; and
- individual decisions, such as whether to stay indoors on polluted days.
- Since the smaller PM2.5 particle concentration was described as having the stronger correlation with all-cause, death rate, and since we could find no mention of advantages of combining this with PM10 values, we decided to base our figure on the PM2.5 values alone.
- Since the St. Mary Lane sensor does not have NOx, O3 or other pollution sensors, we thought it better to use the PM2.5 value to represent overall air pollution. To do this, we concentrated on research which did not control for other air pollution variables, only for social, economic, geographical, and other non-air pollution variables.
- Even then, we found that different studies implied widely different effect sizes (see table 1.1). A 2022 homed in on dementia, but declined to give an effect size. It did however conclude that air pollution, particularly small particle pollution, can affect the heart and the circulatory system, including circulation to the brain. Lacking other quantitative estimate, we eventually selected the 0.6% change in death rate for each 1μg/m3 of pm2.5 implied by the UK Committee On the Medical Effects of Air Pollutants as being both UK specific and authoritative.
- Some studies quote the effect of a larger, 10μg/m3 change in pm2.5, which (since we assume linearity), should be divided by 10.
- Other studies quote the differences in death rates between co-cohorts having even larger differences in air pollution. Confusingly, these are sometimes reported without specifying the difference in pm2.5 which is producing the effect.
- Still other studies report the effect of pm2.5 on specific diseases. Apart from the very common cardiovascular diseases, these can be lower, or very much higher without affecting the all-cause death rate given here.
- The long-term effect is also very different from the short-term effect of changes in pm2.5, which are better estimated by "time-series studies" of, for instance, pollution peaks.

- The slightly higher 1.29% change in all-age, all-cause mortality (for low pollution levels) estimated by this 2018 Havard meta-analysis of 53 air pollution studies.
- The lower mortality effects at low pollution levels implied by figure 4 in ehp.niehs.nih.gov/doi/pdf/10.1289/EHP4438 and shown at top right.
This curve shows a (normalised) death rate varying with the average PM2.5 level in μg/m3 shown along the bottom. Our straight line shows our simplifying assumption. It could be argued that our assumed linear relation overestimates the effect of changes in PM2.5 in low pollution areas. However, this may not be wise. Firstly, some studies have failed to find a safe threshold for PM2.5, and actually show more sensitivity at low pollution levels, with the effect of PM2.5 leveling off at higher levels. Secondly, because particulate levels which are not great enough to kill could nevertheless have extremely deleterious effects on quality of life.
Examples of Pollution Reduction
- Over an average year life span, the 0.6% reduction in death rate associated with a 1μg/m3 lifetime reduction in pm2.5 would result in an increase in life span of about 81.1 * 0.6% = 0.49 years or about 6 months. If, as seems likely, improvements in air pollution improve health as well as death, this could be an extra half-year of good health.
- To see the implications of this for the appropriately 7,000 residents of Ecclesfield Village, we considered the effect of a village-wide 1μg/m3 reduction in PM2.5. Assuming that the UK average death rate of around 1% per year applies to Ecclesfield, this would reduce the expected 7000 * 1% = 70 by 70 * 0.6% = 0.42 deaths/year. If this could be maintained over an 80 year lifetime, then it could give the average resident in the village half a years extra life.
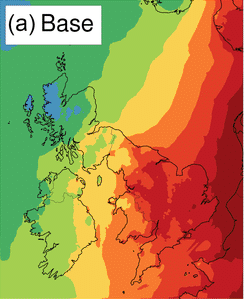
- To see what progress has already been made, we looked at the UK between 1970 and 2010, and found that regulation and technology improvements reduced population average PM2.5 concentration from about 16μg/m3 to about 7.5μg/m3. This was said to have eliminated the cause of 6.62% of all deaths. If this is right, then it seems to explain most of the 80.40 - 71.97 = 8.43 years of extra life expectancy during this period.
Comparison with other harms
-
For UK 15 - 49 year olds in 2015,
in the list of (possibly avoidable)
threats to health,
air pollution comes behind...
- Alcohol,
- smoking,
- drugs,
- high blood pressure,
- high body mass index,
- high total cholesterol,
- low whole grains, low fruit,
- high fasting plasma glucose,
- low vegetables,
- low physical activity,
- low nuts and seeds.
- air pollution.
- One finding on the effects of eating red meat (Table 4 pooled analysis) was that replacing 1 serving of meat per day with fish resulted in a 17% decrease in death rate. If this is so, assuming linearity, one serving per week would have same effect on mean all-cause death rate as 17%/7/0.6% = 4μg/m3 of pm2.5.
- We found reports that road accidents cause 0.3% of all-age, all-cause deaths. If this is true, then a reduction of pm2.5 of 0.5μg/m3 would save as many people as eliminating all road accidents!
- To get an indication of how much public money is spent to save lives in other ways, we looked at comments on the UK National Institute for Health and Care Excellence, and found that they approve treatments costing up to about £25,000 per year. The equivalent expenditure to eliminate 1μg/m of PM2.5 is therefore £25,000 / 2 = £12,500 per person.
Some Sources of PM2.5

- Salt water droplets and surface water pollution lifted into the air by high winds over the ocean (Which we guess are not as deleterious as the particles from combustion).
- Traffic (we have seen an estimate of 22.6% contribution from traffic).
- Industry (we have seen an estimate of 10.3% contribution from Industry).
- Peaks, possibly caused by people walking past the sensor while vaping.
- Sheffield's Bernard Road Incinerator.
Some Problems and Qualifications
- Simple applications of the effect size above assume that the relationship between death rate and pm2.5 is linear. However, research among smokers, and in people subject to second hand smoke and high pollution levels, shows that the effect size drops and use of a constant effect size increasingly over-states the risk. Also, although it makes sense to us to use the stated effect size at low pollution levels, we have not seen any research into the effect of such low levels, and indeed we don't know how studies could prevent the effects of such low level pollution being swamped by other causes of death..
- Since more specific information (such as age) is normally available, such average effects do not really apply to any individual person.
-
The studies we have seen have not controlled for Genetic effects, such as those described by
Christopher Carlsten or
Sharine Wittkopp (2015).
We therefore can't be sure that the correlation between pollution and death rate is simply due to some portion of the many genetic determinants of life expectancy,
also tending to cause people to end up living and/or working in low-pollution areas,
but without acting solely through the environmental factors normally controlled for.
(Although they can't confirm the lifetime effect size, short term studies remain valid. For example...
* Ryan W. Allen et al, 2011, which showed that use of a portable air (HEPA) filter not only reduced pm2.5 from 11.2 to 4.6μg/m3, but also improved inflammatory bio-markers. Most of that pollution came from indoor and outdoor burning of wood,
* Cheneta et al, 2011 in which Chinese pollution was reduced from 96.2 to 41.3mg/m3, and * Dorina Gabriela Karottki et al, 2013, which showed that a class H11 HEPA filters installed in both the bedroom and living room reduced pm2.5 from an average of approximately 8 to 4μg/m3, and particle number concentration from 7669 to 5352, but failed to show a significant effect on the bio-markers of people aged 51-81 living within 350 metres of roads handling >10,000 vehicles/day. This may have been because of the large variations in the effectiveness of the filters during the trial.
) - Since we have not looked for studies which controlled for other constituents of air pollution, simply adding their effect to the effect of PM2.5 described here is likely to produce an overestimate of the net effect.
- The all-age death rates we have seen say little or nothing about the period over which exposure has to occur to produce the observed health effects. Periods mentioned varied from 10 years, to whole life averages. It could easily be that the major part of the effect of pm2.5 exposure occurs from ages 0-6, or even prenatally
- Although we are hoping that the effect on death rates due to different causes can be compared, the levels of any disability related to those causes, may be very different, and could dominate any comparisons made.
- Although PM2.5 appears from the references given here to be the component of air pollution best correlated with all-age, all-cause death rate, since they are composed of different materials, and may have different types of surface, different PM2.5s from different sources may have widely different effects.
- The biological action of particulates may be related to their surface area, in which case, since the total area of all the smaller particles tends to be greater than that of the larger ones, it is possible that the even smaller, ultra-fine PM0.1 particles that are causing most of the harm, not the PM2.5s (Robert F. Phalen 2019 and Li Peng et al. 2019 ). Such particles can also penetrate cells more easily, even getting in to the mitochondria within cells
Pollution Events
- The fire at Arthur's Skip Hire and Waste Management, Parkwood Road, Neepsend on 2020-05-28.
- The 24 hour mean pm2.5 reached 46μg/m3 around Halloween and Bonfire night 2019, and 38μg/m3 on the following New Year's eve.